View real-time and historical readings from multiple sensors, enabling comprehensive monitoring and analysis of environmental conditions.


In security systems, Sensor devices serve a different purpose than cameras - they are mainly used for environmental data collection and monitoring.
Initially, due to the limited number of Sensors in the security ecosystem, we managed them alongside camera products within the same interface.
/Platform Level/
The security system requires an automated alarm workflow upgrade, with Sensors as crucial triggers needing strategic positioning within the alarm framework.

/Product Level/
As more Sensor products launch, the early mixed management approach lacks consistency. We need to redefine Sensor's role in the mature security ecosystem.

/User Level/
Growing demand for digitized Sensor parameters has generated extensive feedback requesting improved management and viewing experiences.


01
Users Feedbacks

Users expect sensors to provide richer data visualization capabilities, including historical trend charts, quick data previews, and timeline logging, to make data viewing more intuitive and convenient.
02
Competitive Analysis
Verkada
Provides site-based sensor data overview, enabling users to quickly understand overall conditions. Through indexed charts and dedicated alert sections, helps users rapidly access key data insights and focus on important information.


Ajax
Integrates editing and viewing functions together, streamlining operations and improving efficiency. Supports multi-timezone adjustment features, enhancing system reliability and enabling users to track historical data.


Currently, if users want to view sensor data, they can only click on the sensor in the device list and view the current environmental status in the side panel.

From user feedback, we can clearly perceive users' expectations for Sensor management functionality, and their demands are highly specific. To build a systematic data monitoring experience, we need to see the deeper needs hidden behind users' specific feature requests.


We adopt a bottom-up methodology for setting improvement targets, using data insights as our foundation while striving to provide a sense of security as our final goal.
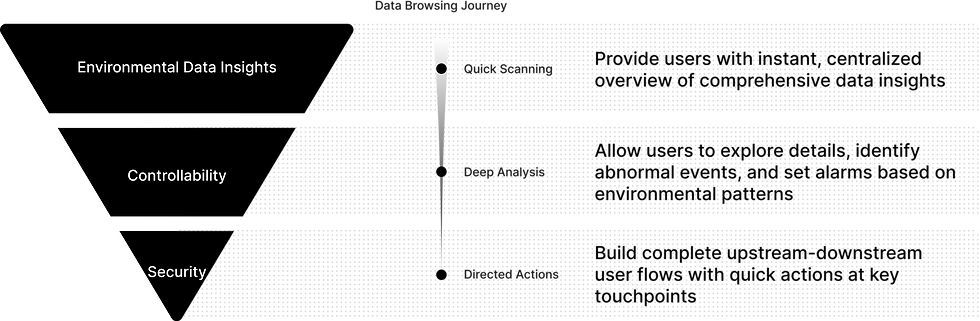
01 Quick Scanning
Build sensor data-centered visual dashboards that maintain consistency with the security platform while helping users rapidly locate abnormal events.

02 Deep Analysis
Users can define custom abnormal events and analyze targeted sensor trends and history to assess incident severity.

MVP Version - Setting Abnormal Events
In the MVP version, we placed the setting of anomalous data thresholds in a modal. Users set thresholds through manual input during task flow.
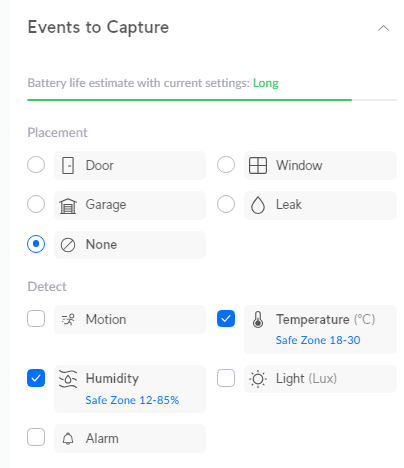

Optimized Setting Abnormal Events
In this optimized version, we improved the anomaly event setting experience by integrating it with the timeline. This allows users to provide safer security zones more intuitively, helping them set more reasonable usage scenarios based on historical zones.

Full-screen sensor page

03 Directed Actions
Establish relevant upstream and downstream touchpoints within the platform to help users build complete operational pathways from problem identification to resolution.
[Upstream] Dashboard - Configure Sensor Widget
We display sensor status with anomalous sensors prioritized at the top. Users can click directly to connect to full-screen view of that sensor's historical data.

[Downstream] Sensor Full-Screen Page - Quick Action Setup
Hover over abnormal events to reveal "Go to Timeline" operations in the table information section. Clicking navigates to the "timeline" page positioned at the abnormal event's start time, helping users analyze the root cause of the anomaly.

Starting Point as[Device Page]
Considering that users have long been accustomed to viewing environmental data on the device details page, we retained this entry point and optimized the overall experience, ensuring users can smoothly transition to the new Sensor Manager functionality without feeling operational disruption.

Standardized Chart Interactions and Designed a Progressive Data Exploration Flow
In the Sensor Manager, I designed standardized interactions between charts and tables based on users’ browsing habits and operational behaviors. These interaction patterns have since been adopted as a standard across similar use cases.
At the same time, the multi-touchpoint user path, designed to support progressive data exploration, has been extended to other device types, such as cameras and doorbells, becoming a reusable model for activity browsing across the platform.
